Using the Pipeline Monitor
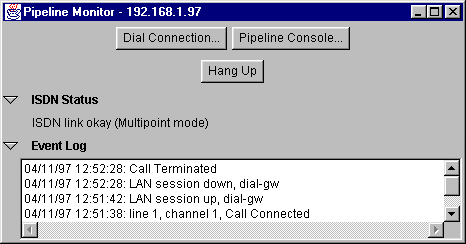
The Pipeline Monitor lets you monitor the status of the Pipeline unit as well as make and disconnect ISDN connections manually. It displays the current status of the ISDN line as well as events that occur during Pipeline operation.
Starting the Pipeline Monitor
You can start the Pipeline Monitor in one of two ways:
- By opening the Programs > Ascend Pipeline folder in the Start menu and double-clicking the Pipeline Monitor icon.
- By clicking the Open Monitor... button in any of the JBPC tabs.
It is also started automatically after you complete the Pipeline QuickStart.
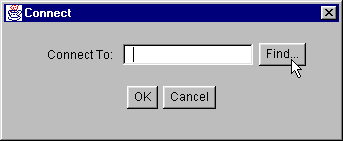
When you first start the Pipeline Monitor, the following dialog box appears:

To connect to a Pipeline:
- Click Find.
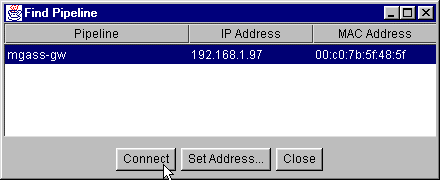
A list of Pipelines on your local network segment appears.

- Click the name of the Pipeline you want to monitor if it is not already highlighted and then
click Connect.
The following dialog box appears:
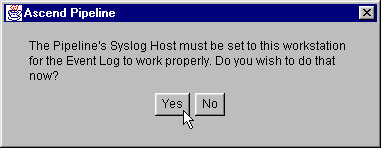
- Click Yes.
Viewing the status of the ISDN line
The ISDN Status section of the Pipeline Monitor displays the current status of your ISDN line.
These status messages appear during normal operation of the Pipeline:
The following messages indicate a problem with the Pipeline:
- The ISDN port appears to be disconnected
- No ISDN is detected
- The ISDN port is not functioning
- The ISDN port has been disabled
- Switch type or SPIDs are incorrect
- Could not determine the status
- Could not determine the status (SNMP error)
If any of these error messages appear, see the Troubleshooting section of your Pipeline manual.
Hiding the ISDN Status display
To hide the ISDN Status display, click the triangle to the left of the ISDN Status heading. To show the ISDN Status display if it is hidden, click the triangle again.
Viewing events
The Event Log section of the Pipeline Monitor records a variety of events that occur during Pipeline operation, including when calls are made and terminated and when connections is made to the remote network. For Pipeline 50 and 75 units, it also records ISDN line and channel usage.

Removing events from the Event Log
To remove events from the Event Log, select them as you would text in a text editor or word process and then press the Backspace or Delete key.
Hiding the Event Log display
To hide the Event Log display, click the triangle to the left of the Event Log heading. To show the Event Log display if it is hidden, click the triangle again.
Opening the Pipeline Console from the Pipeline Monitor
To open the Pipeline Console from the Pipeline Monitor, click the Pipeline Console... button.
Manually connecting and disconnecting
Normally, a Pipeline automatically connects to and disconnects from remote networks. To manually connect to a remote network:
- Click Dial Connection... .
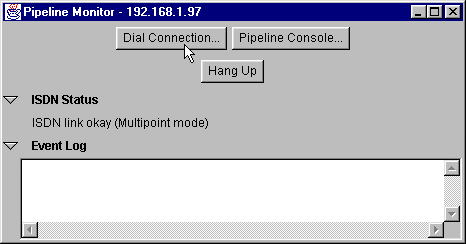
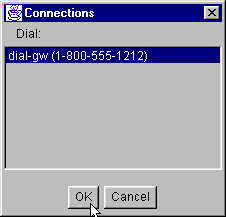
The Connections dialog box appears.

- If more than one connection profile is listed, click the name of profile to use.
- Click OK.
To manually disconnect:
- Click Hang Up.
